Displaying 1 to of records
Instructions
Find the resource you are looking for by using the “Filter by” function above. Click the arrows next to “Categories” and “Topics” to see the keywords you can use to filter these resources. Choose an overall subject area under Categories; and choose more specific themes under Topics. Use any combination of Categories and Topics to filter these resources. To remove a filter, click the “X” by the filter name, or click “Remove All Filters” to reset the filtering.
Contact Information
Do you have any questions or suggested resources to add to this Library? If so, please contact NRPA’s Evaluation Department at NRPAEval@nrpa.org.
Climate Mapping for Resilience and Adaptation Hub and Assessment Tool
National Oceanic and Atmospheric Administration
This tool will show you how climate conditions in your local area are projected to change over the next few decades. The results can help clarify what types of resources in your community will be impacted by climate-related hazards and can help jumpstart your climate adaptation and mitigation strategies. Climate projections provided include variables related to extreme heat, drought, wildfire, flooding, and coastal inundation.
Wildfire Risk to Communities
U.S. Forest Service
Wildfire Risk to Communities is a tool that allows you to search for information on wildfire risk for communities, counties, states and Tribal areas. It displays the risk to homes, wildfire likelihood, exposure and vulnerable populations while providing an overall assessment of risk compared to the rest of the country. Included are tailored suggestions on how to reduce wildfire risk in the chosen area by suggesting specific actions that can be taken by a variety of different groups, including land managers, planners, homeowners and elected officials.
U.S. Census Bureau Community Resilience Estimates
United States Census Bureau
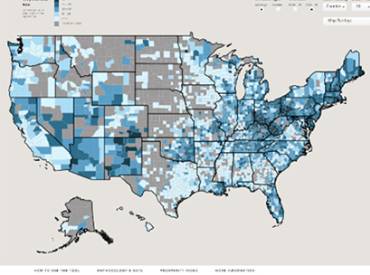
The U.S. Census Bureau Community Resilience Estimates is an interactive mapping tool that estimates the ability of a community to handle the impacts of a disaster. This measure of resilience can help with disaster preparedness by identifying which communities may need additional resources and information to mitigate the long-term impact of disasters. The percentage of the population within a county (or census tract) with varying number of risk factors (disability, no health insurance, no broadband internet access) is displayed. Comparisons to the national average also are provided.
The Opportunity Atlas
Opportunity Insights – Harvard University
The Opportunity Atlas tool answers the question: which neighborhoods in America offer children the best chance to rise out of poverty? Using anonymous data that follows 20 million Americans from childhood to their mid-30s, The Opportunity Atlas traces the roots of today’s wealth back to the neighborhoods where people grew up. This tool identifies where and who is missing out on opportunity. It can inspire local solutions to help more children rise out of poverty.
Social Capital Atlas
Opportunity Insights – Harvard University
Using social media data from 21 billion friendships on Facebook, the Social Capital Atlas tool measures the strength of relationships and communities. This concept, known as social capital, plays an important role in community-level outcomes — including a child’s chances of rising out of poverty. The tool measures community cohesiveness, economic connectedness and civic engagement. Data is available at the county, zip code, college and high school levels.
Screening Tool for Equity Analysis of Projects (STEAP)
The Screening Tool for Equity Analysis of Projects (STEAP) tool allows users to select existing highway segments or draw lines on a map representing proposed roadways. The STEAP tool then provides estimates of the socioeconomic characteristics of the population surrounding the locations. This analysis of communities adjacent to existing roadways, or along future-planned roadways, helps bring equity factors into the analysis of transportation and land-use planning.
Rural Health Map
NORC at the University of Chicago
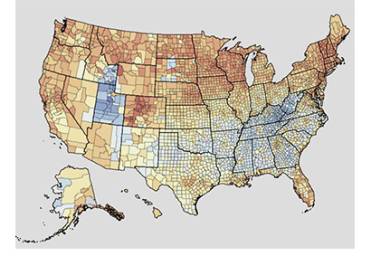
The Rural Health Map is a mapping tool that allows users to overlay health-related measures with key sociodemographic and economic variables. Users can filter the map to view either predominantly rural or urban counties. Data is presented at the county level and fact sheets are available comparing county data to state and national data. The fact sheets also include healthcare providers within each county and their respective addresses. Insights derived from this tool can be used to target resources and interventions, as well as inform efforts — particularly in rural areas.
Rural Data Explorer
Rural Health Information Hub
The Rural Data Explorer tool provides information on a wide variety of rural health issues. A diversity of demographic and health information is available for viewing by state and by county. Comparisons between metropolitan and nonmetropolitan counties can be made, then compared to state and nationwide data.
Risk Factor
First Street Foundation
The Risk Factor tool estimates the likelihood and severity of risk from flooding, wildfire, heat, and wind today and in 30 years as a result of a changing climate. It can estimate impact for specific addresses or broader geographics, such as cities/towns, counties or states. The tool generates a score on a 1-10 scale and a detailed report for each of the four risk areas. The tool can be used to assess the risk of specific properties or entire areas (such cities, counties). An upgraded version of the tool also is available for purchase.
Migration Patterns
Opportunity Insights – Harvard University
The Migration Patterns mapping tools show where individuals move between childhood (at the age of 16) and young adulthood (at the age of 26). Using the map, you can analyze migration patterns by various demographic groups (such as parental income level and race/ethnicity). You also can toggle the view to see where young people moved “To” or moved “From” for a certain area. The percentage of young people who stayed in an area also is provided. This can help an agency better serve its constituents by understanding where newly relocated young adults are coming to their community from, as well as understanding where young adults in their community are moving to.
Mapping Inequality
University of Richmond – Digital Scholarship Lab
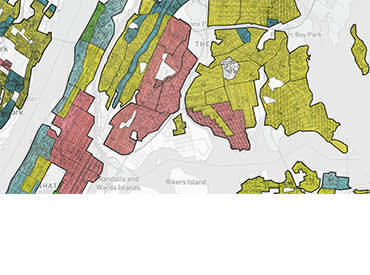
This mapping resource uses historical maps and data to visualize the historical practice of “redlining.” This process was implemented by the U.S. Government’s Home Owners’ Loan Corporation between 1935 and 1940 to identify areas considered “safe” for banks and other mortgage lenders and which ones were considered “hazardous.” This practice was often conducted on racially-motivated grounds, with majority-white areas being prioritized for investment and non-white areas disadvantaged in accessing financing. The effects of this racist practice are still felt to this day. Using historical data, this tool demonstrates which communities within select larger cities were prioritized and which communities were not.
Environmental Justice Index
Centers for Disease Control and Prevention and Agency for Toxic Substances and Disease Registry
The Environmental Justice Index is a mapping tool that compares cumulative impacts of environmental injustice on health for communities. The tool also identifies environmental and social factors that may affect an area’s health and well-being. Some of these factors include air and water pollution, exposure to toxic sites, the built environment (such as lack of parks and walkability), transportation infrastructure, sociodemographic variables and pre-existing chronic disease. The tool can help communities identify areas that may require additional attention and action to improve health and health equity.
EnviroAtlas Interactive Map
Environmental Protection Agency
EnviroAtlas Interactive Map is an extensive tool that provides access to more than 500 maps and analytical tools centered on ecosystem services, biodiversity and human health. The information included helps provide an understanding of the relationship between the environment and human health and well-being. The tool is designed for anyone interested in learning more about the environment and does not require any special expertise.
EJScreen: Environmental Justice Screening and Mapping Tool
Environmental Protection Agency
Environmental Justice Screening (EJScreen) displays publicly available environmental and demographic data for Census blocks, tracks, cities and counties within the United States. EJScreen allows users to create maps detailing environmental and demographic data, while also overlaying key community infrastructure — such as parks, schools, hospitals and places of worship. Reports can be generated from the user-created maps.
Climate and Economic Justice Screening Tool
Council on Environmental Quality
In January of 2021, President Joe Biden issued Executive Order 14008. The order directed the Council on Environmental Quality (CEQ) to develop a new tool called the Climate and Economic Justice Screening Tool. The tool has an interactive map and uses datasets that are indicators of burdens in eight categories: climate change, energy, health, housing, legacy pollution, transportation, water and wastewater, and workforce development. The tool uses this information to identify communities that are experiencing these burdens. These are the communities that are disadvantaged because they are overburdened and underserved. Federal agencies will use the tool to help identify disadvantaged communities that will benefit from programs included in the Justice40 Initiative. The Justice40 Initiative seeks to deliver 40 percent of the overall benefits of investments in climate, clean energy and related areas to disadvantaged communities.
Area Deprivation Index
Center for Health Disparities Research – University of Wisconsin
The Area Deprivation Index is a mapping tool that displays the relative socioeconomic conditions of neighborhoods using a measure called the Area Deprivation Index (ADI). The ADI is created from publicly-available data in the theoretical domains of income, education, employment and housing quality. Rankings of neighborhoods are created by comparing the ADI of a neighborhood to both the nation and the state the neighborhood is located within. Areas with greater socioeconomic disadvantage are ranked higher. The tool can help identify neighborhoods experiencing the highest levels of disadvantage and in need of prioritization for future investment.
Municipal Equality Index
Human Rights Campaign Foundation
The Municipal Equality Index measures how inclusive the laws, policies and services of municipalities are for LGBTQ+ community members. Small, medium and large cities are rated on non-discrimination laws, employment policies, municipal programs, law enforcement and leadership on LGBTQ+ equality. This data can inform the design of more equitable policies and practices.
Crime Data Explorer
Federal Bureau of Investigation
The Crime Data Explorer is an interactive tool that explores national, state and law enforcement agency-level data on violent and property crime and provides data on hate crimes, arrests, law enforcement use-of-force, and other topics. The data can be useful for developing programs and services that address community safety needs.
Youth Risk Behavior Surveillance System
Centers for Disease Control and Prevention
The Youth Risk Behavior Surveillance System provides survey data on health behaviors that contribute to leading causes of death and disability among adolescents including unhealthy diets; reckless and drunk driving; weapons in schools; bullying; alcohol, tobacco and drug use; and risky sexual behavior.
Statewide Comprehensive Outdoor Recreation Plan Library
Society of Outdoor Recreation Professionals
The Society of Outdoor Recreation Professionals maintains a library of Statewide Comprehensive Outdoor Recreation Plans (SCORP) from all 50 states. These SCORPs provide important information that guide outdoor recreation planning and priorities at the state level. Most reports include valuable data about residents’ outdoor recreation participation behaviors/preferences, outdoor recreation park/amenities inventories, and other state-specific data that might be useful to local park and recreation professionals.
National Visitor Use Monitoring (NVUM)
U.S. Forest Service
The U.S. Forest Service NVUM program produces estimates of recreational visits to National Forests and Grasslands. It also generates key information about these visits including what activities visitors were participating in, their visit duration, satisfaction with their experience, amount of money spent, and their demographics. The NVUM results application allows you to explore this data at the national, regional or forest level. This dataset details a variety of recreation-based activities and experiences that could be valuable to park and recreation agencies adjacent to U.S. Forest Service lands.
Social Vulnerability Index
Centers for Disease Control and Prevention & Agency for Toxic Substances and Disease Registry
Social vulnerability refers to factors that can weaken how a community responds to a disaster, such as poverty, lack of transportation access, and crowded housing. Using U.S. Census data, the Social Vulnerability Index (SVI) identifies and maps the social vulnerability of counties and census tracts, which can help agencies improve their preparation and response to emergency events.
National Survey on Drug Use and Health
Substance Abuse and Mental Health Services Administration and RTI International
The National Survey on Drug Use and Health provides national- and state-level data on the use and misuse of alcohol, tobacco and drugs in the United States. The data can help communities identify high risk populations and develop programs and services that support prevention and recovery.
Integrated Resource Management Applications (IRMA) Portal
National Park Service
Through IRMA, the National Park Service (NPS) provides access to a variety of NPS-generated information. Statistics are provided detailing historic, current and forecasted park visitor use. Other data includes information about natural and cultural resources in the parks, water quality, biodiversity/species and park management. This information may be useful to understand more about nearby NPS units.
County Health Rankings & Roadmaps
The University of Wisconsin Population Health Institute, with support provided by the Robert Wood Johnson Foundation
County Health Rankings & Roadmaps provides county-level data on health, social and economic factors such as unemployment, access to healthy food, air and water quality, income, smoking and high school graduation rates. County snapshots allow for comparisons between counties and the identification of trends. The data can be used to assess and plan for equitable community services.
National Equity Atlas
National Equity Atlas
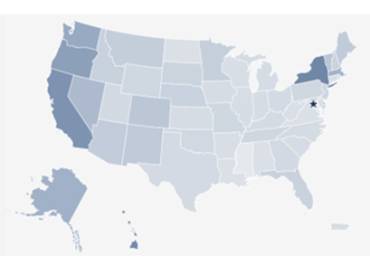
The National Equity Atlas provides data on demographic changes; access to economic, educational, social and health resources; and the economic benefits of equity within a community. Data is available for all 50 states, the District of Columbia and 430 large counties. This data can help drive policy making and investment in equitable and inclusive growth. The Racial Equity Index is a summary score of how successfully communities are addressing equity as compared to peer communities (i.e., city to city, state to state, region to region). By comparing scores on such indicators as median wage, poverty, disconnected youth, education level, air pollution, and rent burden, communities can identify priority areas for closing racial equity gaps.
Homelessness Data
National Alliance to End Homelessness
The National Alliance to End Homelessness provides an interactive tool to explore rates of homelessness on a national, state and region level. Trends in homelessness rates and demographics are available dating back to 2007. This data will help to understand the extent of homelessness in an area as well as the number of available beds dedicated to assisting persons experiencing homelessness. The data can be used for planning, policymaking and advocacy to address homelessness.
Institute for Health Metrics and Evaluation (IHME)
University of Washington
The Institute for Health Metrics and Evaluation offers tools to measure health status and trends across the United States as well as at the local level, including such topics as life expectancy, mortality, cause of death, diet, alcohol and substance use, diet, environmental exposure, health care spending and the coronavirus (COVID-19) pandemic.
Child Opportunity Index
diversitydatakids.org
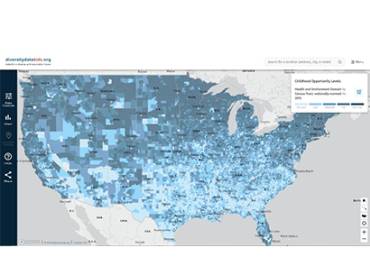
The Child Opportunity Index measures, maps, and compares neighborhood features that impact healthy child development across three domains: education; health and environment; and social and economic. Indicators measured include walkability, access to healthy food and green space, air quality and heat exposure. The data is available for all 72,000 neighborhoods or census tracts in all 50 states and in Washington, D.C., and it can be used to inform youth development resource allocation, policy and advocacy, research, and community engagement efforts.
PLACES – Local Data for Better Health
Centers for Disease Control and Prevention (CDC), the Robert Wood Johnson Foundation and CDC Foundation
PLACES is an interactive mapping tool that explores chronic disease-related data across four categories: Health Outcomes, Prevention, Health Risk Behaviors and Health Status. Data is provided at the city, place (incorporated and census designated place), census tract, and ZIP code tabulation area level and can help jurisdictions plan and implement public health interventions.
ParkServe
The Trust for Public Land
Across the United States, more than 100 million people don't have access to a park within a 10-minute walk of home. The free, publicly accessible ParkServe® mapping platform empowers users to plan and advocate for new local parks to help close the park equity gap. Based on a comprehensive parks database for more than 14,000 cities and towns across the country, ParkServe shows parks, their 10-minute walk service areas, and the neighborhoods that do not have a close-to-home public park. Health, equity and environmental metrics are used to prioritize where new parks are needed first.
ParkScore index
The Trust for Public Land
Trust for Public Land’s ParkScore® index provides a comprehensive evaluation of park systems in the 100 most populated cities in the United States. The index aggregates information from public and private organizations supporting parks in each city and evaluates each city park system according to five categories: access, investment, amenities, acreage and equity. Cities are scored by comparing their data in each category to the median across all cities. The primary goal of the index is to help city leaders and residents advocate for needed park resources and provide relevant data to inform local park improvement efforts. This tool could be particularly helpful for planning efforts by larger park and recreation agencies.
National Health Interview Survey
Centers for Disease Control and Prevention
The National Health Interview Survey presents data gathered from in-person household interviews on topics such as physical and mental health status, chronic disease, disability, access to healthcare, insurance coverage, and prescription drug use, which can support the development of community programs and services.
National Health and Nutrition Examination Survey
Centers for Disease Control and Prevention
The National Health and Nutrition Examination Survey presents data on the health and nutritional status of adults and children that can inform the design of health-related programs and services. Data is gathered from demographic, socioeconomic, dietary, and health-related interview questions as well as physical examinations.
County Explorer
National Association of Counties
The National Association of Counties provides an interactive mapping tool that visualizes a variety of county-level information on topics such as demographics, the economy, education, healthcare and public safety. It provides county profiles that summarize key topical datapoints. Comparisons between counties also are available.
Aggregated National Homeless Education Data
National Center for Homeless Education
The National Center for Homeless Education summarizes the extent of homelessness among public, school-age children. Data about the number of youth experiencing homelessness and the settings they are predominantly residing in is available at the national and state levels. This data can support policymaking, advocacy and planning aimed at reducing the prevalence of homelessness among youth.
Outdoor Recreation Satellite Account
Outdoor Industry Association
The Bureau of Economic Analysis provides data on the impact of outdoor recreation on national- and state-level economies. The Outdoor Industry summarizes this data in an interactive map. This data includes sales or receipts generated by outdoor recreation activities and the impact of outdoor goods/services towards Gross Domestic Product. This data can be useful for advocating about the economic impact of outdoor recreation and the ways the industry supports jobs and wages.
National Opioid Misuse Community Assessment Tool and Prosperity Index
NORC at the University of Chicago
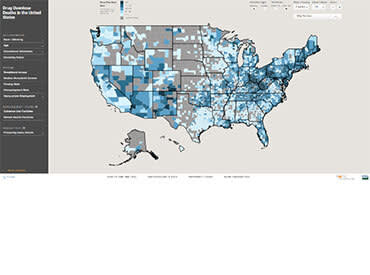
The National Opioid Misuse Community Assessment Tool is an interactive tool that overlays county-level drug overdose mortality rates with data on sociodemographic and economic factors such as unemployment, education, poverty and broadband access. The tool’s prosperity index measures economic risk, economic resilience, social risk and social resilience to determine how vulnerable a county is to a public health crisis, which can support response planning.
Community Crime Map
LexisNexis Risk Solutions
The Community Crime Map visually displays crime activity in local communities. This map empowers the community members to analyze and interpret crime activity in their local areas. It can be a helpful tool for planning purposes to target interventions and programming towards areas where reducing criminal incidents is most needed.
How’s My Waterway?
Environmental Protection Agency
This tool from the Environmental Protection Agency provides information about the condition of waterways at the community, state and national levels. Overall water quality ratings are provided as well as quality ratings for specific activities such as swimming, drinking and eating fish. This tool may be helpful for maintaining public safety and planning for natural resource management.
National Risk Index for Natural Hazards
The National Risk Index is an interactive mapping tool that visualizes areas of the United States most at risk of natural hazards. Data is viewable at the county and Census tract level. In addition to the Risk Index, data on expected annual losses due to natural hazards, social vulnerability (the susceptibility of groups to natural hazards), and community resilience measures (the ability to prepare for, withstand, and recover from natural hazards) are included in the map. This information could be helpful in identifying, preparing for and mitigating risk/loss from natural hazards at all levels of geography.
Fire Incidents for States and Counties
Federal Emergency Management Agency (FEMA)
Fire Incidents for States and Counties is a FEMA resource that provides a visual snapshot of fire prevalence, fire types, and causes of residential fires in states and counties across the United States. This information may be useful in planning for natural resource management and public safety purposes.
Disability Statistics
Cornell University
This site offers access to disability data on a range of topics from various data sources, including the American Community Survey, the Current Population Survey and U.S. Equal Employment Opportunity Commission Charge data. The data can help with service and program planning to meet specific community needs.
Health
U.S. Census Bureau
The U.S. Census Bureau provides accurate, detailed and up-to-date statistics relating to health in America. Subtopics included are disability, expenses and investments, fertility, health insurance, HIV/AIDS, and small area health insurance estimates. This site primarily provides access to raw data which requires some skill for conducting follow-up analyses for planning and policy purposes.
Explore Census Data
U.S. Census Bureau
The U.S. Census Bureau is a leading provider of quality data about the people of the United States. Data available include age and sex; education; employment; family and living arrangements; income and poverty; language; population; and housing estimates, race and veterans. This data is available to view and download. Many of the other sources included on this website utilize Census data in their analyses and visualizations.
Annual Survey of State and Local Government Finances
This survey collects data on local government revenues, expenditures, debt and assets for all 50 states and the District of Columbia. One of the local government functions assessed is parks and recreation. Park and recreation professionals could use this data to understand trends in local government revenues and expenditures for park and recreation services, and to compare support for other local government services (e.g., fire protection, policy protection, highways). These data could be valuable for benchmarking, advocacy and planning purposes.
Annual Survey of Public Employment & Payroll
U.S. Census Bureau
This survey collects data on state and local government employees and their payroll information. Information from all 50 state governments and approximately 90,500 local governments are included in the survey. Park and recreation employee and payroll data is included in the dataset. This information could be valuable to park and recreation professionals looking to benchmark their employee and salary information against other agencies within their state. Analyzing trends in employment and payroll also might be of value.
Behavioral Risk Factor Surveillance System
Centers for Disease Control and Prevention
The Behavioral Risk Factor Surveillance System (BRFSS) offers national- and state-level survey data on individuals’ health risk behaviors, chronic health conditions, and use of preventive services. BRFSS also collects data on emerging health issues such as vaccine shortages. Its data can be used to monitor community trends, identify at-risk populations, and support health-promoting services and policy making.
Community Assessment Tool
SparkMap and the Center for Applied Research and Engagement Systems (CARES)
The SparkMap Community Assessment Tool allows users to create quick and powerful reports about communities and their characteristics. To generate a report, select a location (state and county) and the data indicators of interest. Users can save, share and print the generated reports. This community assessment tool will be helpful to guide planning efforts by allowing for easy access to key insights on community characteristics.
Map Rooms
Center for Applied Research and Engagement Systems (CARES)
The Center for Applied Research and Engagement Systems (CARES) provides interactive mapping tools with 25,000 data layers available. Broad data categories that could be included in a user-generated map are civic/social, economic, education, environment, and health indicators. Once finalized, the map can be exported and shared. These mapping tools could be helpful to spatially explore key topics of interest through an intuitive mapping program.
AirData
Environmental Protection Agency
AirData provides a variety of current and historical air quality data from outdoor monitors across the United States. Visualization tools can be populated detailing trends in air quality and pollutants at the county and city levels. Data is also available for download. This information could be helpful in understanding air quality in specific locations and inform planning for public safety and outdoor recreation planning.
