

Gain a greater understanding of the current state of park and recreation agencies by downloading the 2019 NRPA Agency Performance Review.
Interact with More Data
Dig deeper into the agency performance data with these interactive figures presenting detailed crosstabs of the data for every table and chart presented in the 2018 NRPA Agency Performance Review:
- Park Facilities (residents per park, acres of park land, indoor and outdoor facilities)
- Programming (programs offered and programs for children, seniors, people w/ disabilities)
- Responsibilities of Park and Recreation Agencies (spanning from operating parks and facilities to programming types)
- Staffing (FTE counts and key staff responsibilities)
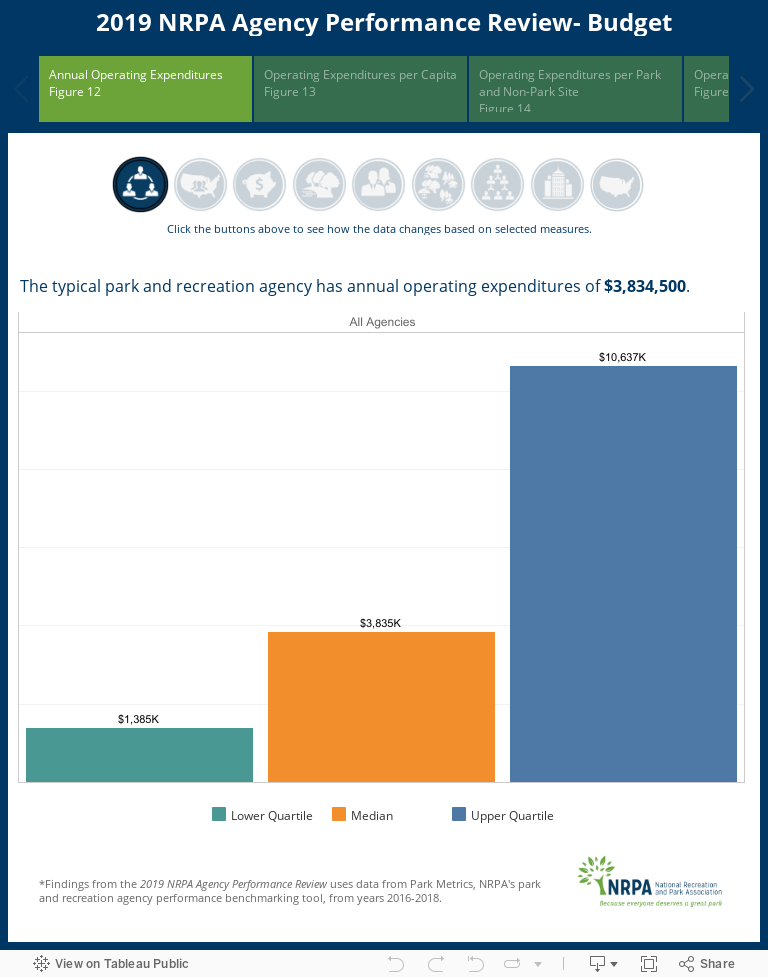
- Agency Funding (sources of funding, cost recovery, capital spending)
- Policies (tobacco, alcohol, healthy food options, fees)