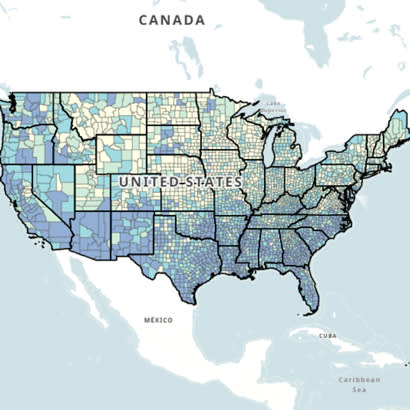
Have you ever wished you had data on which parts of your community were most in need of investment? While it’s likely you already know which areas could be considered “at-risk,” hard data on community vulnerability would likely be valuable for your agency’s planning and operations. To help fill this gap, NRPA released the Data and Mapping Resource Library. Contained within the library is the Social Vulnerability Index (SVI), which will help you answer questions like this.
Data and Mapping Resource Library
The library contains a collection of publicly available databases and visualizations relevant to park and recreation professionals and advocates. These public resources serve as a starting point for exploring data on a variety of topics. This blog post dives deeper into the library and how to use it.
The number of resources in the library might be overwhelming at first. Periodically, NRPA staff will release blog posts featuring specific resources included within the library. The goal is to provide direction on how to access and benefit from selected resources that are most broadly applicable to park and recreation professionals.
Identifying Vulnerability
This blog post features the Social Vulnerability Index (SVI) — a resource provided by the Centers for Disease Control and Prevention/Agency for Toxic Substances and Disease Registry (CDC/ATSDR).
The SVI measures social vulnerability; defined by CDC/ATSDR as the potential negative effects on communities caused by external stresses on human health. The SVI is a valuable tool to identify communities that will most likely need support before, during and after a public health emergency. More broadly, SVI is an indicator of which areas of a community are considered “at risk” and most in need of investment to reduce vulnerability and increase overall health.
SVI Interactive Map
The SVI Interactive Map displays vulnerability information down to the census tract level. Census tracts are particularly helpful as they are smaller than city or county-wide boundaries and provide the ability to drill down on specific areas within a community. This level of specificity is helpful in further understanding the different levels of vulnerability within larger geographic areas (such city, county, state).
For example, a census tract analysis will allow you to compare the vulnerability of one part of your jurisdiction to another. This granular comparison may illuminate differences in vulnerability (or inequities) that may exist in your community; thus, helping to guide future capital and operational investments your park and recreation agency makes.
How to Use the Social Vulnerability Index
To learn more about the SVI and how to use the interactive map, please watch the 8-minute video below:
What do you think about the SVI? How have you used it before? Let us know in the comments!
Disclaimer: “The inclusion of this data resource in the Library does not constitute its endorsement or recommendation by the U.S. Government, Department of Health and Human Services, or Centers for Disease Control and Prevention. The material is available on the agency website for no charge.”
Austin Barrett (he/him) is an Evaluation Manager with NRPA.

