 Throughout the United States, the end of the school year and classes presents a period of leisure, family vacations, visits to relatives and, for many, the opportunity to participate in a wide variety of fun and challenging experiences at the local park department’s summer camp. Once seen as a summer playground mainly organized to provide a place for kids to be when parents are at work, summer camps have grown in complexity and diversity of activities. Sports, cultural arts and even fun educational activities make summer camps a desirable place to be with friends.
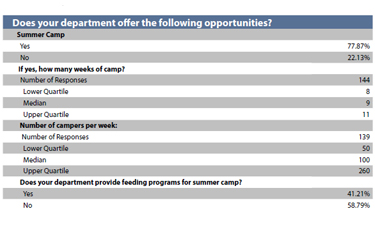
NRPA’s PRORAGIS database shows that almost 78 percent of park and recreation departments offer summer camps. In general, the camps are offered for a median of nine weeks during the summer with a median of 100 campers per week. This, of course, probably includes many who sign up for some or all additional weeks.
The basic distribution of the sample jurisdictions shows many of the respondents are from cities. The city, town and smaller special districts are more likely to provide summer camps than some of the large, natural resource-based counties and special districts (although some of these offer nature study or environmental-education camps or programs during the summer).
A growing trend for communities is to offer summer camps for special populations. Many youth can be included in the primary camp with appropriate accommodations. Others in need of individual attention and care may have specialty camps to allow for the same summer-camp experience of their peers. More than 61 percent of responding departments provide programs for special populations. Of that group, almost 98 percent are included in the primary program. Of the remaining participants with significant disabilities, 80 percent are offered summer-camp opportunities through the departments.
The responses from our sample are shown in the following table. There were a total of 470 respondents for fiscal year 2012.
PRORAGIS Data on Summer Camps
May 1, 2013, Department, by National Recreation and Park Association

