


Being tech-savvy generally means being well-informed about or proficient in the use of modern technology. While not all of us may be tech-savvy, we have all been compelled to be at least “tech-competent” or “tech-comfortable” in the COVID-19 pandemic era during which we may be teleworking from home fully or partially, staying in touch with family and friends remotely, and carrying out other activities using our computers and/or phones rather than in person.
Within the context of park planning, many community meetings have been held online for the past two-plus years. While not ideal, virtual engagement does offer certain benefits, such as making it easier for some members of the public to participate in meetings from the comfort of their homes without having to travel, arrange for childcare, etc. Also, new tools have been developed to make virtual community meetings more engaging and interactive.
As a park planner for the Los Angeles County Department of Parks and Recreation (DPR), I have recently worked on numerous projects which have involved the use of the latest tools for community engagement, and data collection and analysis. In this article, I would like to highlight a few tools we used as part of the 2022 Parks Needs Assessment Plus (PNA+) which is a new study that complements and offers new information not previously included in the 2016 Los Angeles Countywide Parks and Recreation Needs Assessment (PNA). Specifically, PNA+ report contains data, analyses, and recommendations in support of expanding land conservation and restoration, transit to parks, and other strategies to meet regional and rural recreation needs, especially in the most vulnerable communities.
- Map-based Surveys: As part of the PNA+, we conducted various online surveys to collect public input on regional and rural park needs in L.A. County. We decided to use a software called Maptionnaire which integrates survey questions with photos and interactive maps. Having an interactive map was important because it allowed respondents to pinpoint on maps where they lived, which parks they used, which areas they thought needed more parks and recreational amenities, etc. Maptionnaire also enables efficient collection, analysis and visualization of map-based data. In addition, the data collected can be downloaded in formats supported by major geographic information system (GIS) software.
- Live Polling: We held over a dozen community workshops online for the PNA+ because we were unable to have in-person meetings due to COVID-related health directives. To make the meetings more interactive and gather instant public opinion, we conducted live polls using Mentimeter to design a wide variety of interactive polls. Polls are quick and easy to build with this tool and responses from the audience appear in real-time as dynamic visualizations. Mentimeter can also be used to create live word clouds that highlight the most popular responses to poll questions.
- Live Notetaking: During the community workshops, we thought that it would be important for the public to see that their ideas and comments were immediately and properly captured. We decided to utilize MURAL, which is an ideation and visualization tool that functions as a digital whiteboard. With MURAL, we were able to easily add ideas, suggestions, feedback and thoughts using sticky notes in real-time. We received positive feedback from quite a few meeting participants for using this tool and our accurate notetaking which reflected our attentiveness and understanding of the input being provided.
- Use of Data from Fitness Apps: To learn more about the behaviors and movements of bicyclists and pedestrians (including walkers, runners and hikers) as they relate to park access, the PNA+ includes analyses using data from Strava Metro. As some may know, Strava is a fitness tracking application with millions of members worldwide. Trip data that is provided by members through the application is aggregated and deidentified according to industry standards. This data is then provided at no cost to public agencies like DPR through the Strava Metro online dashboard in an effort to increase the amount of data-driven information about local mobility patterns that is available to those who plan for and make decisions about the development and management of bicycle and pedestrian infrastructure, such as bike paths, sidewalks and jogging/walking paths.
- Use of Cell Phone Generated Human Mobility Data: Generally, detailed information about who visits public parks is limited because it is time-consuming and costly to count and survey individual visitors on location. In order to gain better insights into the visitorship of regional parks, DPR procured cellphone-generated visitorship data from Unacast, a leading location data company. Specifically, the PNA+ offers detailed park visitorship profiles for about 40 regional-serving parks and recreational facilities across the county, including a wide range of park types in diverse settings that offer a variety of recreational opportunities. The visitorship data covers the two-year time frame from January 1, 2019 through December 31, 2020.
While cellphone-generated mobility data provides unprecedented insight into broad patterns of park use and allows park planners to identify and compare systemwide trends, there are some limitations associated with this method of gathering visitorship information. For instance, the data presented in the PNA+ is limited to adults over the age of 18. For sites that attract large numbers of children on field trips where they are not accompanied by their individual guardians, visitorship totals may be understated. Additionally, in areas with poor cellular coverage, some visits may not be reflected or captured in the data.
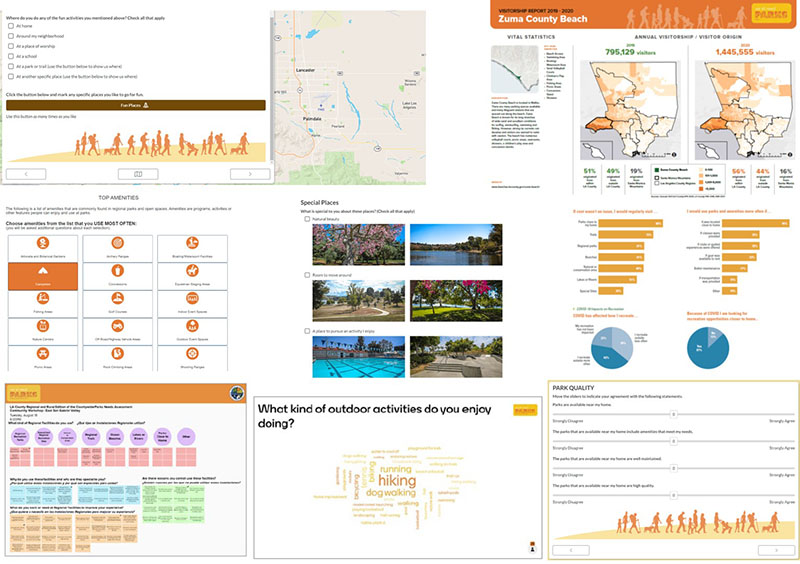
Pictured above: A collage with screenshots of a map-based survey, visitorship report based on cell phone data, live notetaking, a word cloud, and online surveys with graphics and photos. Courtesy of Clement Lau, Los Angeles County Department of Parks and Recreation.
Final Thoughts
Nothing can replace the connections and opportunities for relationship-building that in-person meetings and other activities provide. However, as explained above, there are tools that can help make virtual meetings more engaging, interactive and even fun. Also, online surveys can be much more relatable and visually appealing (than just a standard list of questions) when interactive maps, photos and graphics are included. In addition, there are now sources through which we can acquire accurate mobility data to measure park access, usage and visitorship without conducting labor- and time-intensive studies at individual park sites. While there are certainly limitations and costs associated with the use of technology and the above tools and data sources, it is becoming increasingly important that we add tech-savviness to good old-fashioned customer service in order to better understand and meet the needs of our communities.
Special thanks to the MIG team, our consultants on the PNA+ project, for their creativity and ability to use and leverage the latest tools and sources to collect and analyze quantitative and qualitative data for this important study.
Clement Lau, DPPD, FAICP, is a Departmental Facilities Planner with the Los Angeles County Department of Parks and Recreation.